
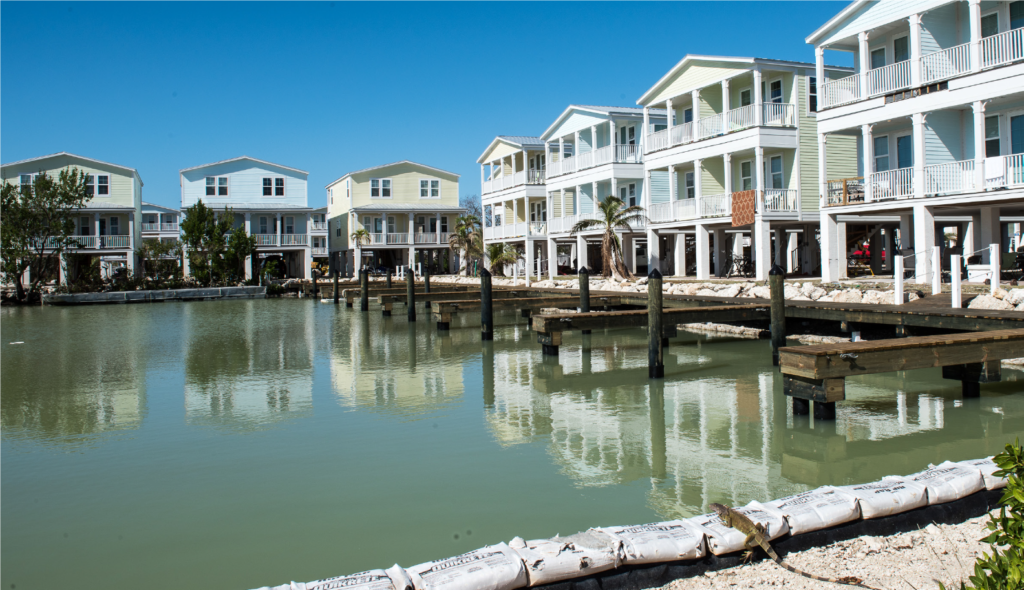
Cover of NIBS Interim Study from Marathon, Florida. “These modern, mitigated homes withstood Hurricane Irma. They are elevated to withstand high water and their roofs are constructed to withstand up to 220 mph winds. Good mitigation learns from mistakes to build more resilient communities.” Photo by Howard Greenblatt, FEMA,, November 22, 2017.
I should have written this blog post six months ago, but better late than never. Last December, the National Institute of Building Sciences (NIBS), Multihazard Mitigation Council, issued Natural Hazard Mitigation Saves: 2017 Interim Report, a welcome update of its highly regarded, widely quoted, 2004 report, Natural Hazard Mitigation Saves: An Independent Study to Assess the Future Savings from Mitigation Activities. Why is this new report still relevant for blog discussion eight months after its release? Because it is having a significant, if not yet profound, effect on public and congressional thinking about the investment of federal dollars in hazard mitigation. That shift is long overdue.
The original report was a landmark in hazard mitigation research in its own right, finding that the nation eventually saved $4 in costs from disaster losses for every dollar of federal money invested in hazard mitigation, a remarkable return on investment by any standard. That report also differentiated specific savings related to specific disaster types ranging from $1.50 per dollar for earthquake mitigation efforts to $9 for flood-related mitigation investments. In short, presuming that specific projects merited investment based on cost-benefit comparisons, the U.S. could prevent a world of pain with timely and effective investments in mitigation projects to reduce such losses.
Still, over the years, the federal government has provided far more money after disasters to support mitigation against future disasters by more generously funding post-disaster programs, primarily the Hazard Mitigation Grant Program (HMGP), than pre-disaster programs such as the Pre-Disaster Mitigation (PDM) program, authorized under the Disaster Mitigation Act (DMA) of 2000 (Sec. 203 of the Stafford Act, 42 U.S.C. 5133). Pilot funding actually began in 1997 under the Federal Emergency Management Agency’s (FEMA) Project Impact, which was terminated by the George W. Bush administration, but by then the DMA was law, and so was PDM. However, secure funding is another matter, and over the years, PDM has been subjected to a roller coaster ride of erratic congressional appropriations. Disregarding the Project Impact years through FY2002, appropriations have ranged from a peak of $150 million when the fund was established in FY2003, to $35.5 million in FY2012, to $25 million in FY2014 following an attempt by the U.S. Department of Homeland Security to zero out the fund and merge it into a single mitigation account, a ploy that did not succeed in Congress. Now the trend is in the opposite direction, with $90 million allocated in FY2017, and dramatically more under consideration for FY2019. In June, the Senate was looking at a proposed allocation of $246 million (House version), according to Meredith Inderfurth, Washington liaison of the Association of State Floodplain Managers. That is the same amount allocated the previous year, so one can hope PDM is stabilizing at a higher level. One must realize, also, that what is proposed from the administration of the moment is not necessarily what is disposed by Congress, where appropriations committees may act under significantly different influences from those affecting the White House.
What is the difference between PDM and HMGP? Most simply, PDM provides funding under a competitive grant system to communities for proposed projects to implement hazard mitigation before disaster strikes, under what some call “blue skies.” By contrast, HMGP funding is a percentage of overall disaster assistance following a presidentially declared disaster. That percentage has varied over time and among states; those with enhanced state hazard mitigation plans, which must meet higher standards and show a deeper state commitment to mitigation, receive a higher percentage of overall disaster assistance in HMGP funds. Currently, for states with enhanced plans, that amounts to 20 percent of overall assistance, in other words, $200 million in HMGP for every billion dollars of disaster aid. The amounts are smaller, beginning with 15 percent for the first $2 billion of aid, and shrinking as percentages of higher levels, for states without enhanced plans. The states then distribute this money to local jurisdictions for specific projects. But no HMGP money exists without a declared disaster.
However, at least the recent revived congressional interest in funding PDM suggests that the emphasis is changing, and it is no accident that this is happening after the release of the NIBS interim report. The $4 savings calculation from the 2004 report has been widely disseminated and quoted in disaster management circles. The new report accentuates that good news with increased savings estimates based on complex studies that have dug much more deeply into the logic of how those savings should be calculated. To be honest, I will not confess to following all the detail in 344 pages of text and appendices in the new report. Economics is not my field. My trust in the numbers, however, grows out of both admiration for the stellar collection of scholars involved in the study and an ability to at least follow the logic of their arguments, if not the details of every calculation. I can at least follow the logic of the methodology, which appears very sound.
What did they find? The report established a new, higher overall savings ratio of $6 for every federal dollar invested in hazard mitigation by “select federal agencies.” It did this by establishing methodology for including new but relevant factors into the cost-benefit calculations the study used. The new study goes farther by also examining investments “to exceed select provisions of the 2015 model building codes,” for which it found a 4-1 benefit-cost ratio. In the latter case, this meant that the analysis focused on those mitigation efforts that used stricter standards for building resilience than those in the model codes. It should be noted here that neither model codes, propagated by nonprofit code development organizations that research the effectiveness of various building standards and promulgate such codes for use by local governments, nor federal mitigation requirements, such as those in the National Flood Insurance Program, prohibit local governments from “going the extra mile” to strengthen protection against various potential disasters.
Like the 2004 study, this one also sought to establish more specific benefit-cost ratios for particular disaster types, for which the efficacy of mitigation investments can vary. Nevertheless, all proved positive to differing degrees. Flood mitigation led the pack, as it did in the earlier study, with a 7-1 ratio for federal investments and 5-1 for exceeding 2015 model code requirements. Investments for exceeding codes for hurricane storm surge bore a 5-1 benefit, but an inadequate sample for federal investments prevented the study from producing a ratio for federal investments. Wind mitigation was 5-1 for both analyses; earthquake and wildland-urban interface yielded 3-1 advantages for federal investments and 4-1 for code exceedance. Overall, however, the dominant area of U.S. losses in disasters has always come from flooding, generally by a very wide margin.
As I noted, a good deal of the refinement materialized from the study’s ability to quantify some aspects of future cost savings that were often left out of the equation in past analyses and in traditional benefit-cost analyses. Rather than paraphrase, I will simply offer the study’s own summary from page 9:
The Interim Study quantified a number of benefits from mitigation, including reductions in:
- Future deaths, nonfatal injuries, and PTSD
- Repair costs for damaged buildings and contents
- Sheltering costs for displaced households
- Loss of revenue and other business-interruption costs to businesses whose property is damaged
- Loss of economic activity in the broader community
- Loss of service to the community when fire stations, hospitals, and other public buildings are damaged
- Insurance costs other than insurance claims
- Costs for urban search and rescue
All these are important facets of the overall costs of disasters, many of which have been hard to quantify in the past. That is what makes this update so significant. What will make it more valuable is for advocates of effective hazard mitigation, whether experts or ordinary citizens, to learn the basic facts of these findings and share them with policy makers at local, state, and federal levels of government, so that it becomes clear that simply rebuilding the same structures in the same hazardous locations after each disaster constitutes a massive lost opportunity. The staggering losses last year from Hurricanes Harvey, Irma, and Maria, combined with the wildfires in California, should be a wake-up call. We can avoid a great deal of tragedy with smart investments in mitigation at all levels of government. Download or scan this study, at least read the summary, and be prepared to make the basic case. It is the fiscally conservative thing to do, in view of the hundreds of billions of dollars that have been poured into disaster recovery.
Jim Schwab