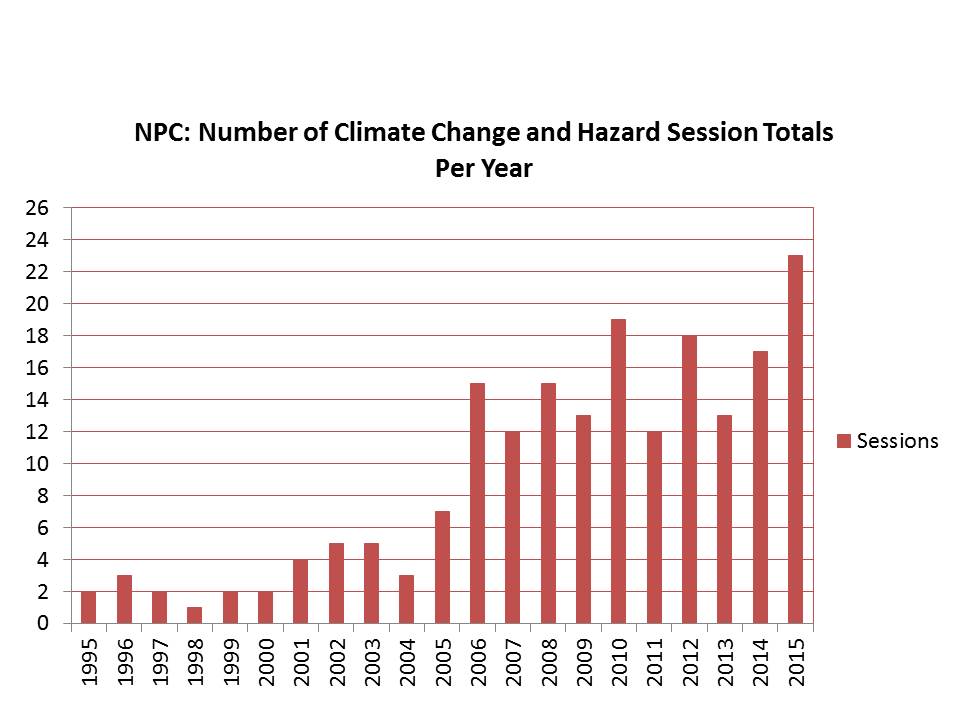
This bar graph and the one below were developed last year for a presentation I did in July 2015 at the opening plenary of the 40th annual Natural Hazards Workshop, in Broomfield, Colorado.
This bar graph and the one below were developed last year for a presentation I did in July 2015 at the opening plenary of the 40th annual Natural Hazards Workshop, in Broomfield, Colorado.